Key Takeaways
- Training data, performance data, and safety data belong to 1 driver, not 3 systems.
- The cost of the disconnect is decisions, not spreadsheet time: coaching the wrong drivers, missed resignation signals, unverified drivers on high-stakes routes, and capital asks built on anecdotes.
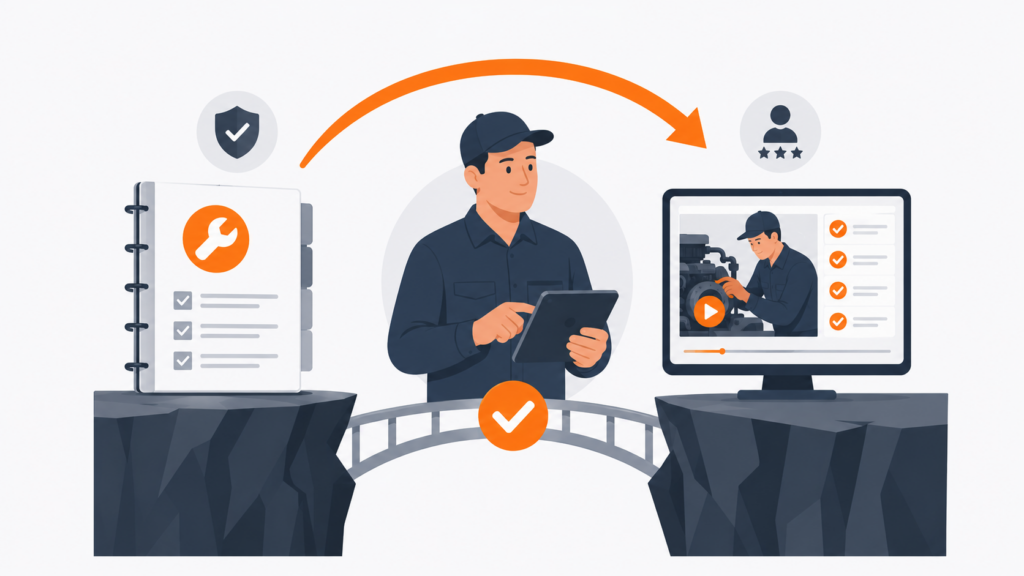
- A workforce development platform pulls the 3 streams into 1 driver record the Director can sort, filter, and export.
- 5 day-to-day decisions get better with a connected view: targeted coaching, early-warning retention, skill-matched dispatch, defensible capital planning, and evidence-backed SLA conversations.
- The payoff compounds: shorter incident response, longer driver tenure, fewer SLA penalties, and a Monday huddle that takes minutes instead of hours.
A Director of Fleet Operations at a regional carrier walks into the Monday huddle with 3 printouts.
- The first is the training completion report: who finished defensive driving last quarter, who is still missing the hazmat refresher, who has the new electronic logging device (ELD) module checked off.
- The second is the road performance report: speeding events per driver, hard-braking counts, idle minutes, miles per gallon, and on-time delivery percentages.
- The third is the safety log: last month’s incidents, near-misses, roadside inspection results, and customer complaints about driving behavior.
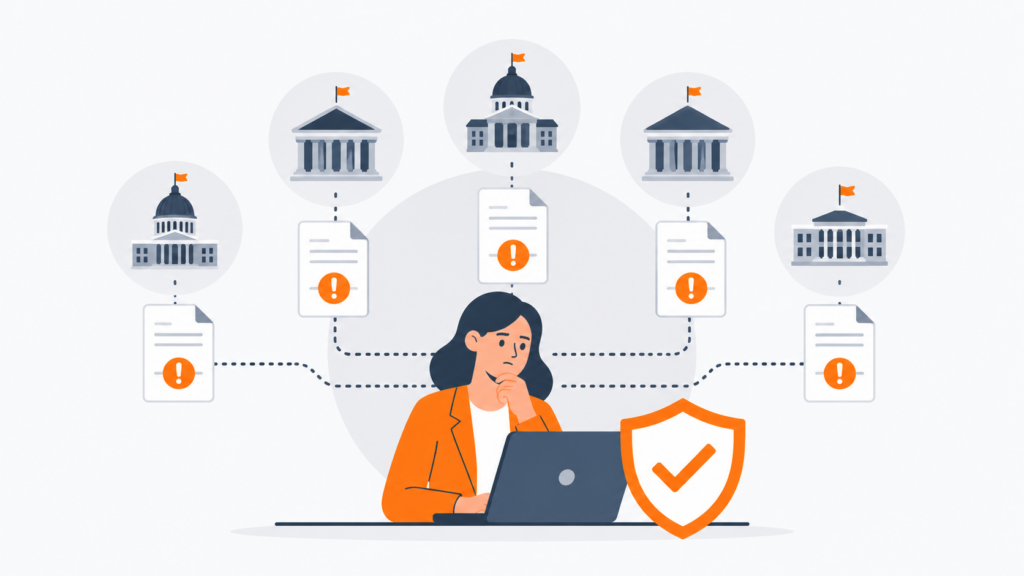
Each report is accurate. None of them connects to the others at the driver level. The Director knows which drivers completed training. The Director knows which drivers are running hot on speeding. The Director knows which drivers had a near-miss in the past 60 days. What the Director can’t tell, without 30 minutes of spreadsheet matching, is which drivers show all 3 patterns at once, the ones the data is flagging but nobody has read end-to-end.
This is the 3-stream problem that defines operations leadership in trucking, last-mile delivery, motorcoach, utility fleets, and field-service fleets. The fleet that pulls training, performance, and safety data into 1 driver record is the fleet that makes decisions based on patterns rather than intuition. This article walks through the 3 streams, the real cost of keeping them separate, what changes when they live in one place, the 5 outcomes the Director walks away with, and how a workforce development platform fits the picture.
The 3 Data Streams a Director of Fleet Operations Already Runs
The 3 streams are not new. The problem is that each one lives in its own system and answers its own question, with no shared driver record across them.
Training Data
Who completed which course, when, and what version? Defensive driving training for commercial drivers, hazmat handling, fatigue awareness, customer-service modules, and the carrier’s own standard operating procedures (SOPs) converted into short courses through an AI course builder or a learning management system (LMS) authoring tool. New-hire onboarding records. Refresher cadence. Skill check-offs after a job change. The training record answers one question: who has been through what.
Performance Data
What the driver does on the road. Captured by the carrier’s road-performance system: speeding events per 100 miles, hard-braking and hard-acceleration counts, idle time, fuel economy, on-time delivery percentage, route adherence, dwell time at customer sites. Some fleets layer dashcam events on top: distracted-driving alerts, following-too-close warnings, eyes-off-road events. Performance data answers a different question: how each driver runs day in and day out.
Safety Data
What has gone wrong, or what almost went wrong? Incidents and accidents with police reports. Customer complaints about driving behavior. Roadside inspection results, including out-of-service findings and driver-side citations. Internal near-miss reports. Workers’ compensation claims are tied to the driver. Safety data answers a third question: what has happened that the carrier has to explain.
The 3 streams sit in 3 systems. The training system holds training. The road-performance system holds performance. The safety log (sometimes a spreadsheet, sometimes a dedicated incident-management tool, sometimes notes in dispatch) holds safety. Each stream is real data. Each stream is accurate inside its own system. The 3 streams just do not talk to each other at the driver level.
What Happens When the 3 Streams Stay in Separate Systems
The real cost of the disconnect is not the time spent reconciling spreadsheets. It is the decisions made on incomplete pictures.
Coaching Goes to the Wrong Drivers
A road-performance report shows 10 drivers with the most speeding events last month. The Director schedules coaching sessions for those 10. What the report does not show is that 6 of the 10 completed defensive driving in the past 90 days, and 4 of them had a near-miss reported by dispatch. The coaching that would matter most is for the drivers with all 3 patterns: missing recent training, running hot on the road, and showing up in the safety log. Without the connected view, the coaching schedule is built on 1 signal instead of 3.
Retention Surprises Pile Up
The driver who resigned Friday had a pattern the data would have shown weeks earlier: declining on-time delivery, rising hard-braking events, a customer complaint, a missed refresher session. Each signal sat in a different system. Nobody read them together. The intervention that might have kept the driver (a route change, a coaching session, a different dispatch partner) never happened because no one saw the pattern in time.
Incident Response Runs Slow
An accident happens on a Wednesday. The Director of Fleet Operations gets the call. The questions from the insurance carrier, the customer, and eventually the regulator are the same: what training did the driver complete, what was the driver’s recent performance pattern, and what was the driver’s prior safety history? Pulling those 3 reports from 3 systems takes a day. Pulling them as 1 record takes a minute.
Fuel-Cost Patterns Stay Hidden
2 drivers running the same route show very different fuel economy. The road-performance data shows the gap. The training data shows one driver completed the fuel-efficient driving module and the other did not. The connected view turns a fuel anomaly into a training assignment. The disconnected view turns it into a budget complaint.
Capital Asks Land With Anecdotes Instead of Data
The next-quarter ask to replace 12 trucks or hire 8 drivers needs to be defensible. The Director who can show driver-level pattern data (training completion plus performance trends plus safety events) tied to the ask has a defensible case. The Director, who can only show 3 disconnected reports, has anecdotes.
How a Workforce Development Platform Pulls the 3 Streams Together
The architectural idea is simple: the driver is the unit of record. Every training course, every performance event, every safety incident ties back to 1 driver ID. A workforce development platform brings data together at the driver level, so the Director can see all 3 streams on one screen.
What the Director sees changes. Instead of 3 printouts on Monday morning, the Director opens 1 dashboard. Each row is a driver. The columns include training completion percentage, training items overdue, road-performance score for the past 30 days, hard-braking and speeding event counts, on-time delivery rate, near-miss count, incident count, customer complaint count, and a calculated risk score that combines all 3 streams.
The dashboard sorts. The Director sorts by risk score, and the top 12 drivers surface. Those 12 drivers are where coaching, retention, and dispatch attention should go this week. The Director clicks one of them. The driver profile shows training history, performance trend lines, and safety events on one screen, with timestamps that line up. The Director can see what happened, when, and what training (if any) was completed before and after each event.
The dashboard filters. Filter by depot, by route type, by vehicle class, by tenure, by hire cohort. The pattern that surfaces in the Atlanta depot might not surface in the Dallas depot. The pattern that surfaces among drivers with under 18 months of tenure might not surface among 5-year veterans. Workforce planning depends on this kind of filter to be useful, not just on aggregate roll-ups.
The dashboard exports. A defensible report on driver-level training, performance, and safety patterns ties to the service-level agreement (SLA) conversation with a customer, the capital ask with the Chief Financial Officer (CFO), the audit response with a Federal Motor Carrier Safety Administration (FMCSA) investigator, and the conversation with the insurance underwriter at renewal. The same data, exported in different shapes, supports different audiences. The next question is what the Director gets out of running the dashboard week after week.
The 5 Outcomes the Director Walks Away With
The 5 outcomes below are not abstract benefits. They are the wins the Director can point to in the next budget meeting, the next CFO conversation, and the next insurance renewal.
Outcome 1: Coaching Capacity Goes to the Drivers Who Actually Need It
The carrier’s coaching capacity is finite. The connected view turns coaching from a calendar exercise into a triage decision. The Director who runs the dashboard weekly stops coaching the 10 drivers flagged by 1 signal and starts coaching the 3 to 5 drivers flagged across all 3. The remaining coaching time goes into deeper sessions with the drivers who actually move the safety needle.
Outcome 2: Driver Tenure Goes Up Because Resignation Signals Get Caught Early
Early-warning patterns surface weeks before resignation: declining on-time rate plus missed refresher session plus rising customer complaints. The Director who reads those 3 signals together intervenes (a route adjustment, a one-on-one, a training reassignment, a partner change) with a real chance of keeping the driver. Each retained driver saves the carrier the full cost of recruiting, onboarding, Entry-Level Driver Training verification, and the months of below-peer performance every new driver runs through.
Outcome 3: High-Stakes Routes Go to the Right Drivers
A premium customer, a narrow window, a sensitive cargo, an oversize load: each is a route the dispatch system should not assign based on tenure and availability alone. The connected view lets dispatch run on tenure, availability, verified skill, recent performance, and safety profile. The customer gets a driver who matches the work. The carrier gets fewer SLA penalties and fewer incident calls from the customer’s risk team.
Outcome 4: Capital Asks Land With Data the CFO Accepts
The next-quarter ask (replace 12 trucks, hire 8 drivers, add a depot, run a coaching program) needs evidence. Driver-level pattern data is that evidence. The Director who walks into the CFO meeting with a dashboard showing which depots have safety patterns that justify investment, which drivers carry customer relationships that justify retention bonuses, and which routes generate enough volume to justify dedicated equipment gets the capital. The Director who walks in with 3 disconnected reports gets the conversation deferred.
Outcome 5: SLA, Audit, and Insurance Conversations Run on Evidence
When a customer asks why on-time delivery dropped, when an FMCSA investigator asks why the driver lacked current DOT compliance training, or when the insurance underwriter asks for the risk profile by depot at renewal, the carrier with a connected view answers in minutes. The carrier with 3 disconnected reports answers in days or asks for an extension. The conversations that decide the next contract, the next inspection rating, and the next premium all run on the same evidence stack.
The 5 outcomes compound. Better coaching keeps drivers longer. Longer tenure produces better SLA performance. Better SLA performance unlocks better customer relationships and lower insurance premiums. Each one buys back time the Director can spend on the work that grows the carrier, instead of on Monday-morning reconciliation.
How KnowledgeCity Fits the Workforce Side of the Picture
KnowledgeCity’s workforce development platform handles the training, skills, and policy side of the connected view. KC Library offers more than 50,000 ready courses covering defensive driving, hazmat handling, OSHA warehouse safety, and supply chain operations. KC Docs carries fleet-specific policy attestation (a new driver handbook revision, a customer-specific safety SOP, a route-specific hazmat protocol) with version control and timestamped sign-off on the same driver record. KC Studio turns the carrier’s own SOPs, route procedures, and customer-specific protocols into short courses with quizzes, assigned and tracked against the same driver.
Training records, skill profiles, policy attestations, and performance review data are stored in a single data model. The Director sees all of them on a single screen for each driver, filters and sorts across the fleet, and exports a defensible driver-level record on demand.
Turn 3 printouts into 1 driver record. KC Library’s driver training, KC Docs’ timestamped policy attestations, and KC Studio’s carrier-specific courses, all on the same driver profile.
Frequently Asked Questions
- What is the 3-stream problem in fleet operations?
3 distinct data streams about each driver reside in 3 separate systems. Training data is in the training system (who finished what, when). Performance data is in the road-performance system (speeding events, hard braking, idle, fuel economy, on-time delivery). Safety data is in a separate log or tool (including incidents, near-misses, roadside inspection results, and customer complaints). Each stream is accurate. None of them connects to the others at the driver level without manual reconciliation. The cost shows up in decisions: coaching the wrong drivers, missing retention signals, slow incident response, hidden fuel patterns, and capital requests made on anecdotes rather than data.
- What does a workforce development platform do for a fleet?
A workforce development platform brings training records, skill profiles, policy attestation, and performance review data onto 1 driver record. The Director sees the full workforce picture on one screen against each driver, sorts and filters across the fleet, and exports a defensible driver-level record on demand for SLA conversations, capital asks, audit responses, and insurance renewals.
- How long does it take to build a connected driver view?
For most fleets, the work starts with picking 1 driver identifier that every system already carries (employee ID, commercial driver’s license number, or a fleet-issued driver ID), then bringing the training and policy data into the workforce platform and pairing it with weekly exports from the road-performance and safety logs. That takes weeks, not months. Deeper integration takes longer, but the operational lift from a weekly export-and-join process starts within the first quarter.
- Where should a Director of Fleet Operations start?
With the dashboard, not the integration. Pick the 10 to 15 metrics that would change the Monday huddle if they all showed up in one place, against each driver: training completion percentage, items overdue, road-performance score, hard-braking and speeding counts, on-time delivery rate, near-miss count, incident count, customer complaint count, fuel economy versus depot peers, and a simple combined risk score. Build that view as a weekly spreadsheet first. Use it for a quarter. The fleets that start with the dashboard get the most operational lift; the fleets that start with the integration buy a tool nobody uses.
References
- Federal Motor Carrier Safety Administration. Safety Measurement System (SMS) Overview.
- Federal Motor Carrier Safety Administration. Entry-Level Driver Training (ELDT) and Training Provider Registry.
- U.S. Bureau of Labor Statistics. Occupational Outlook Handbook: Heavy and Tractor-Trailer Truck Drivers.
- Federal Motor Carrier Safety Administration. Drug and Alcohol Clearinghouse.
- American Transportation Research Institute (ATRI). Operational Costs of Trucking (most recent annual edition).
- KnowledgeCity. Transportation and Logistics industry page: KC Library, KC LMS, KC Studio, KC Docs, and KC Safety.
- KnowledgeCity. Comply suite: KC Docs policy attestation and KC Safety incident management.