Enjoying the preview?
This is the free first lesson. Get full access: request a demo or sign in.
Enjoying the preview?
This is the free first lesson. Get full access: request a demo or sign in.
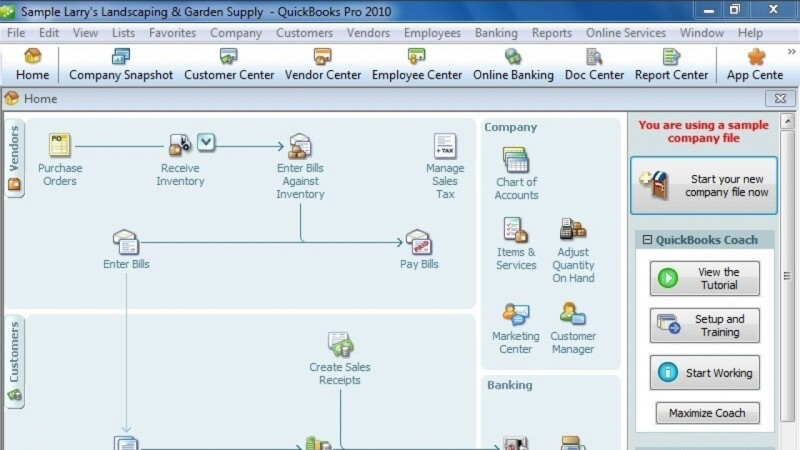
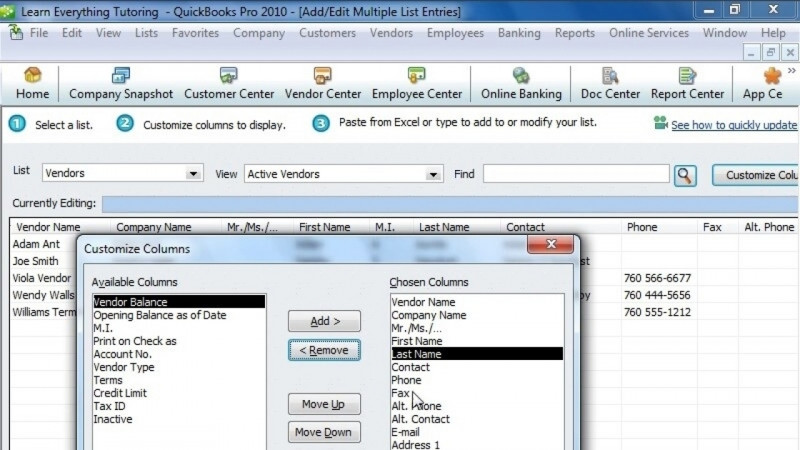
In these lessons, we will discuss how analyze Financial Statements in Excel. We will explore how to set percentile, high and low filters, and how to visually format cells for ease of use. We’ll also look at using Excel Quick Books. Quick Books is one of the most popular accounting software systems, while Excel is the most powerful data analytics tool available to most users. We’ll discuss how to transfer information between the two systems, as well as how to link between the two to create relational data sources. These relational databases deliver a level of consistency and data integrity crucial to producing accurate financial statements.
This course will explore Financial Statement Analysis using Excel. We’ll look at visualization methods, importing and exporting, and how to create relational data sources. We’ll also discuss Quick Books, and how to link or transfer financial data between Quick Books and Excel.
This course explores financial statement analysis using Excel, including visualization methods, setting percentile, high, and low filters, formatting cells, importing and exporting, and creating relational data sources. It also covers QuickBooks and how to link or transfer financial data between QuickBooks and Excel.
The course focuses on Excel and QuickBooks. QuickBooks is one of the most popular accounting software systems, while Excel is described as the most powerful data analytics tool available to most users, and the course shows how to transfer and link information between the two.
You will gain skills in accounting analysis, business analysis, financial accounting, financial analysis, financial analysis software, and financial statement analysis.
The lessons cover low, high, and percentile formatting; importing, exporting, and linking data; and creating a data model in Excel.
Linking or transferring data between QuickBooks and Excel creates relational data sources, and these relational databases deliver consistency and data integrity that are crucial to producing accurate financial statements.